AVAA Alumni Analytics Dashboard
A case study on building a fully interactive Power BI dashboard for AVAA, supported by Python scripts that extracted, cleaned, and prepared alumni data from historical spreadsheets.

Overview
During my software developer internship at AVAA, I helped digitize internal processes for the ProExcelencia program, a talent accelerator for high-potential university students in Venezuela.
My main project was a fully interactive Power BI dashboard for alumni analysis. It helped the team explore graduate outcomes, satisfaction, location, academic data, and employment information without manually filtering spreadsheets.
I also wrote Python scripts to extract, clean, and prepare historical data before loading it into Power BI.
The problem
AVAA had useful alumni data, but it was spread across different spreadsheets and historical records. This made reporting slow and difficult to maintain.
The project focused on three needs:
- recover and structure scholar activity data from 2020 to 2023
- reduce manual spreadsheet work through Python scripts
- give stakeholders one interactive place to understand program impact
What I built
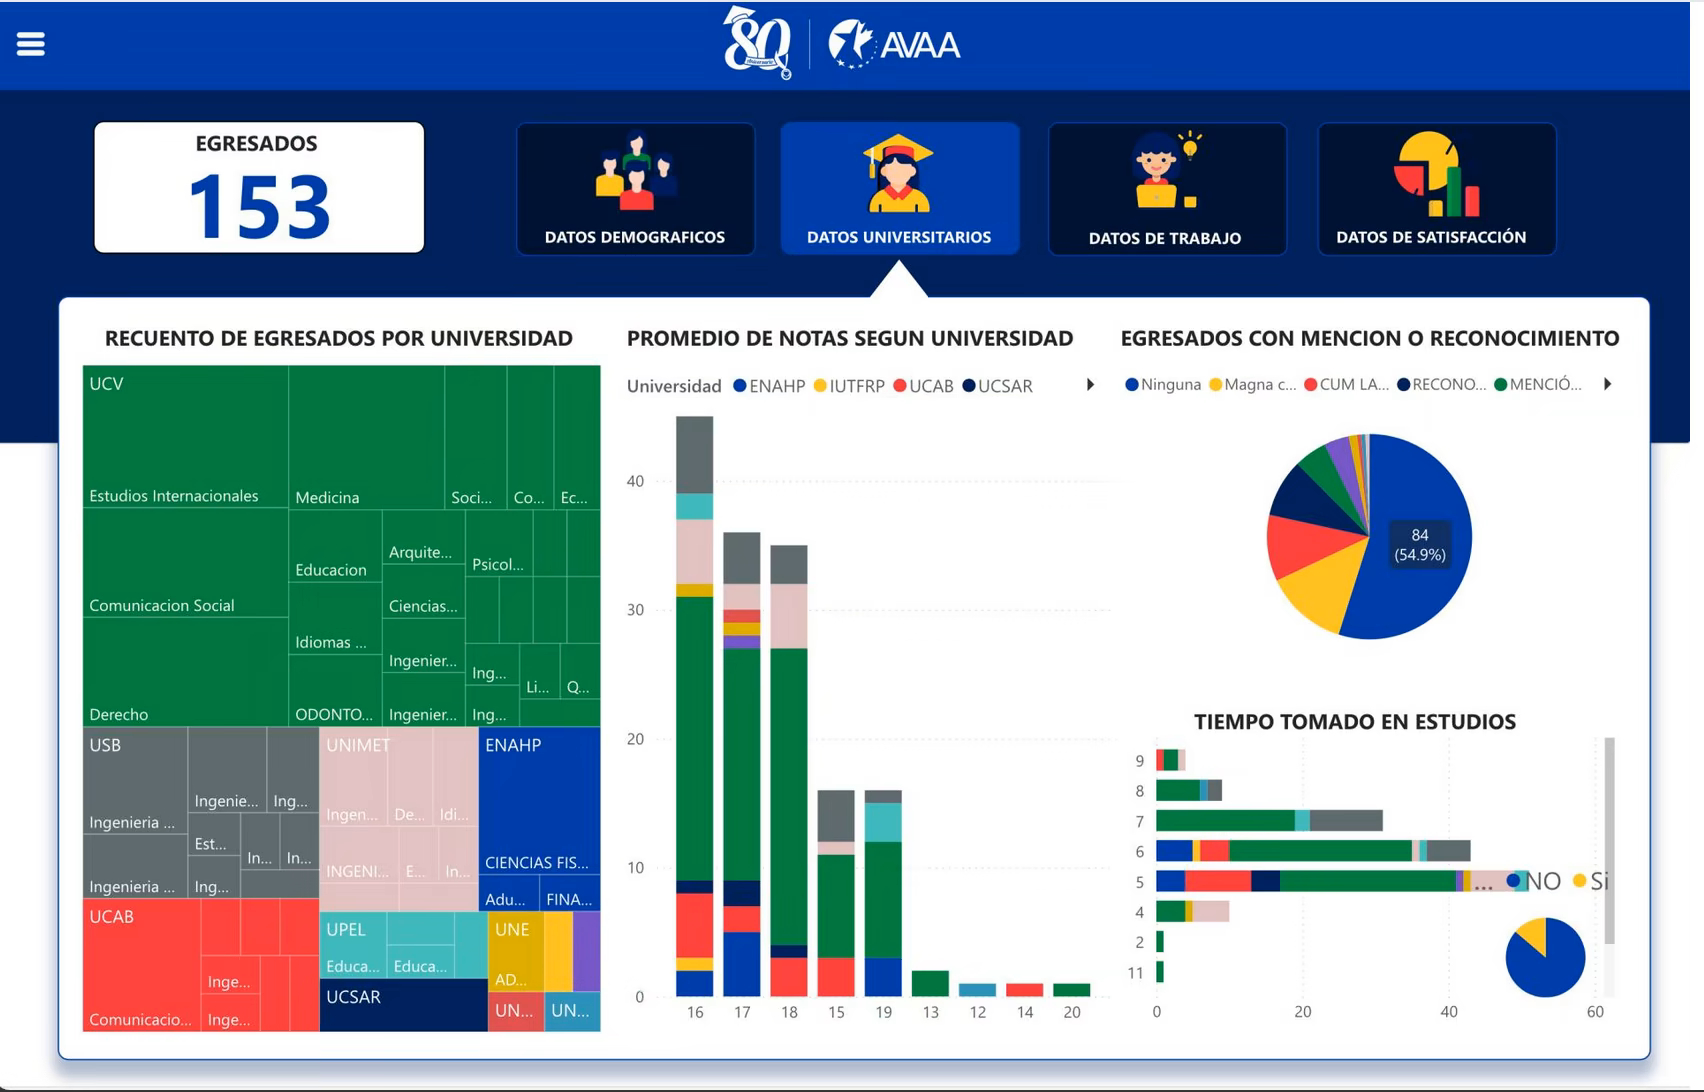
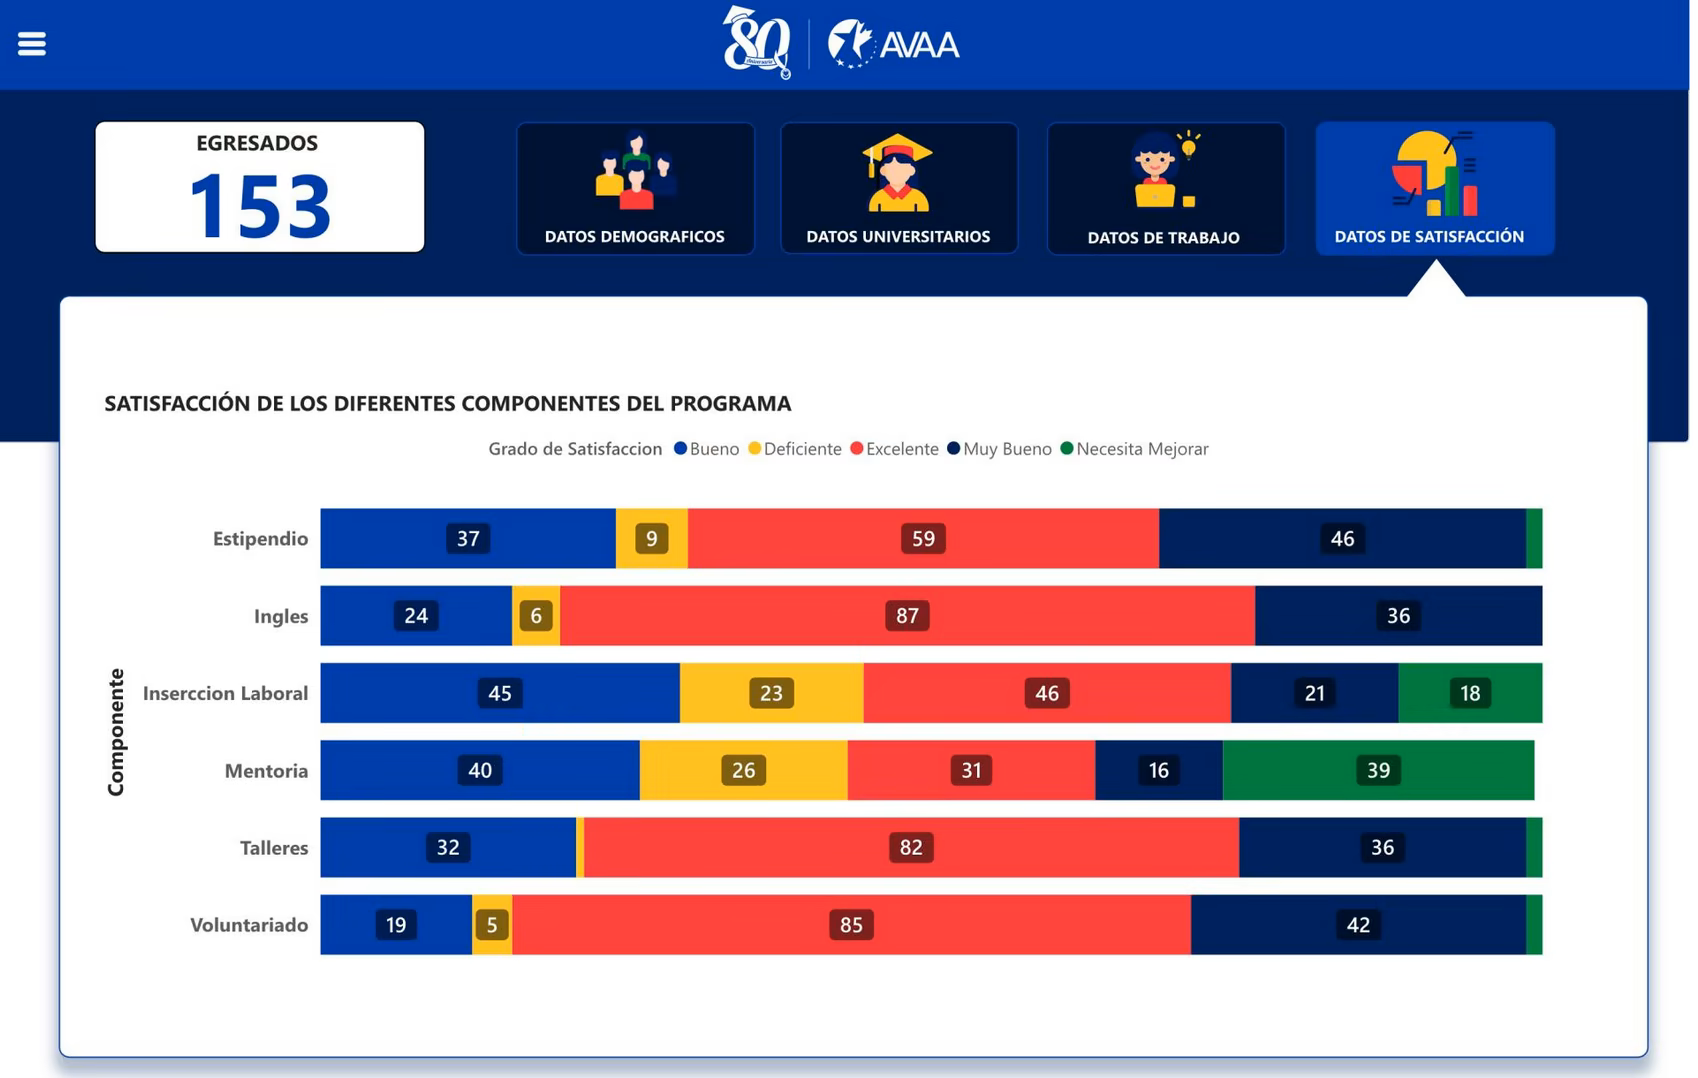
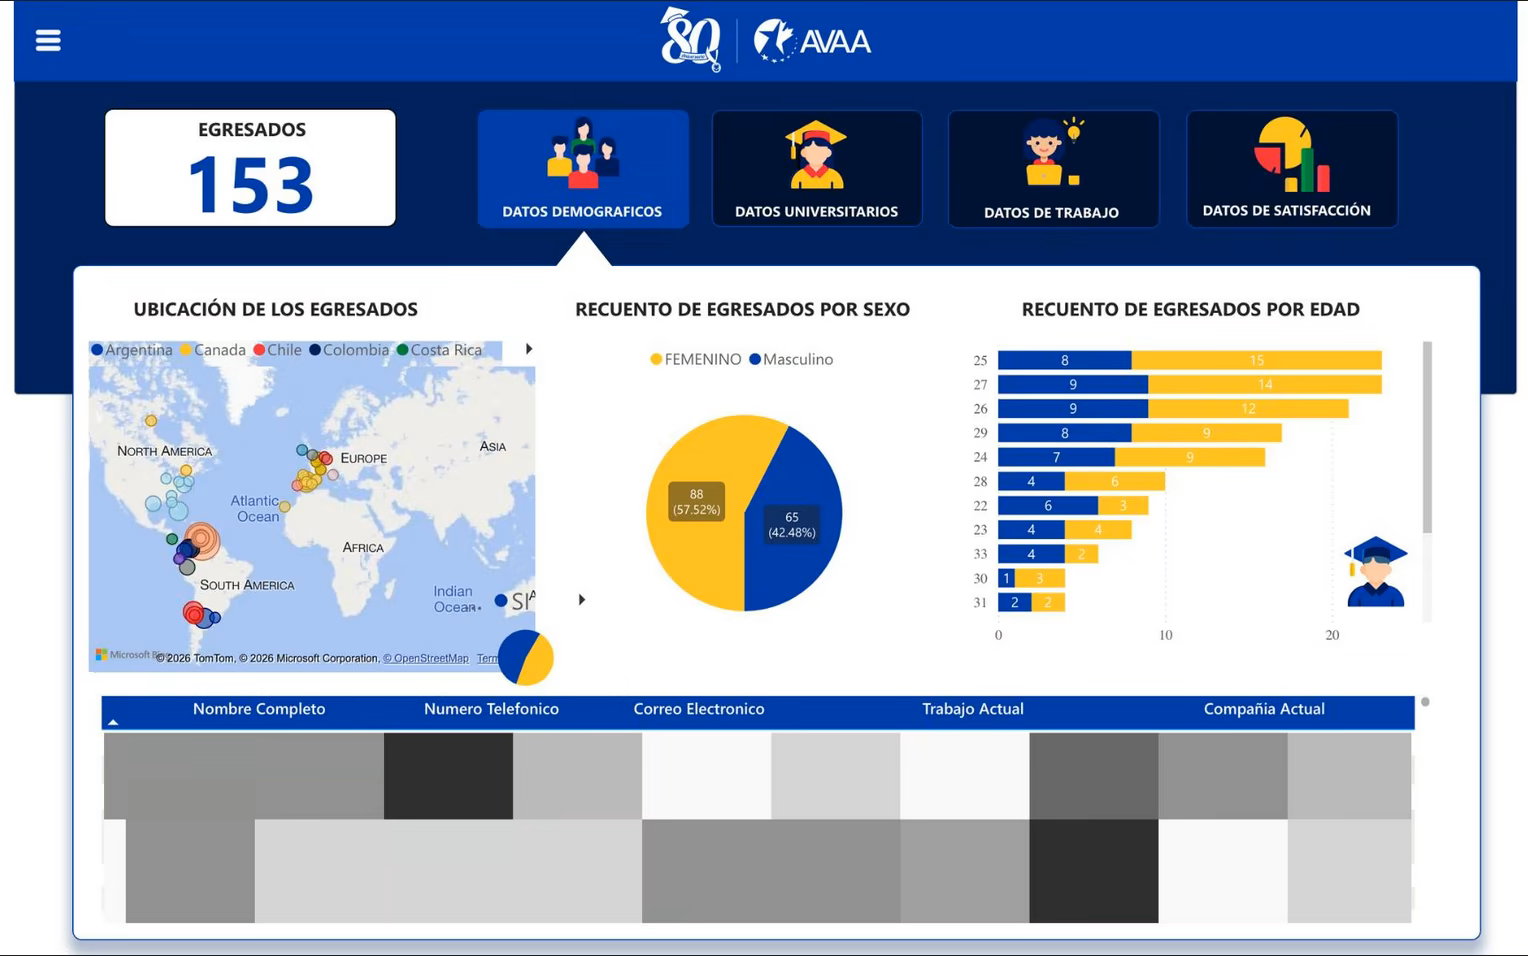
I built a Power BI dashboard with sections for demographics, university data, work information, and satisfaction results. The dashboard included filters, maps, tables, stacked charts, and summary cards so the team could move from a general alumni count to more specific questions.
The Python scripts helped prepare the source data by normalizing spreadsheets, organizing alumni fields, and reducing repetitive cleanup before analysis.
Dashboard screens
Outcome
The dashboard turned scattered alumni records into a clearer analytics workflow for AVAA.
It helped the team:
- track long-term program impact
- review demographic, academic, work, and satisfaction data
- reduce manual work in scholar tracking
- prepare structured historical data for future SEP integration
This project gave me practical experience connecting software development, data cleaning, and program operations. It also showed me how much a dashboard depends on the quality of the data process behind it.